
Sean McClure is a GIS Specialist with a passion for spatial analysis and cartographic design. With years of experience in geographic information systems, Sean has contributed to impactful projects in urban planning, environmental research, archaeological analysis, and more. His expertise spans data visualization, geospatial data management, and remote sensing analysis. Below are examples of the various project Sean has worked on spanning from 2021 to present. If you wish to contact Sean McClure, feel free to email (seanmcclure30@gmail.com) or message him on LinkedIn account with the link at the bottom of the page.
Iberian Peninsula CO2 Emission StoryMap
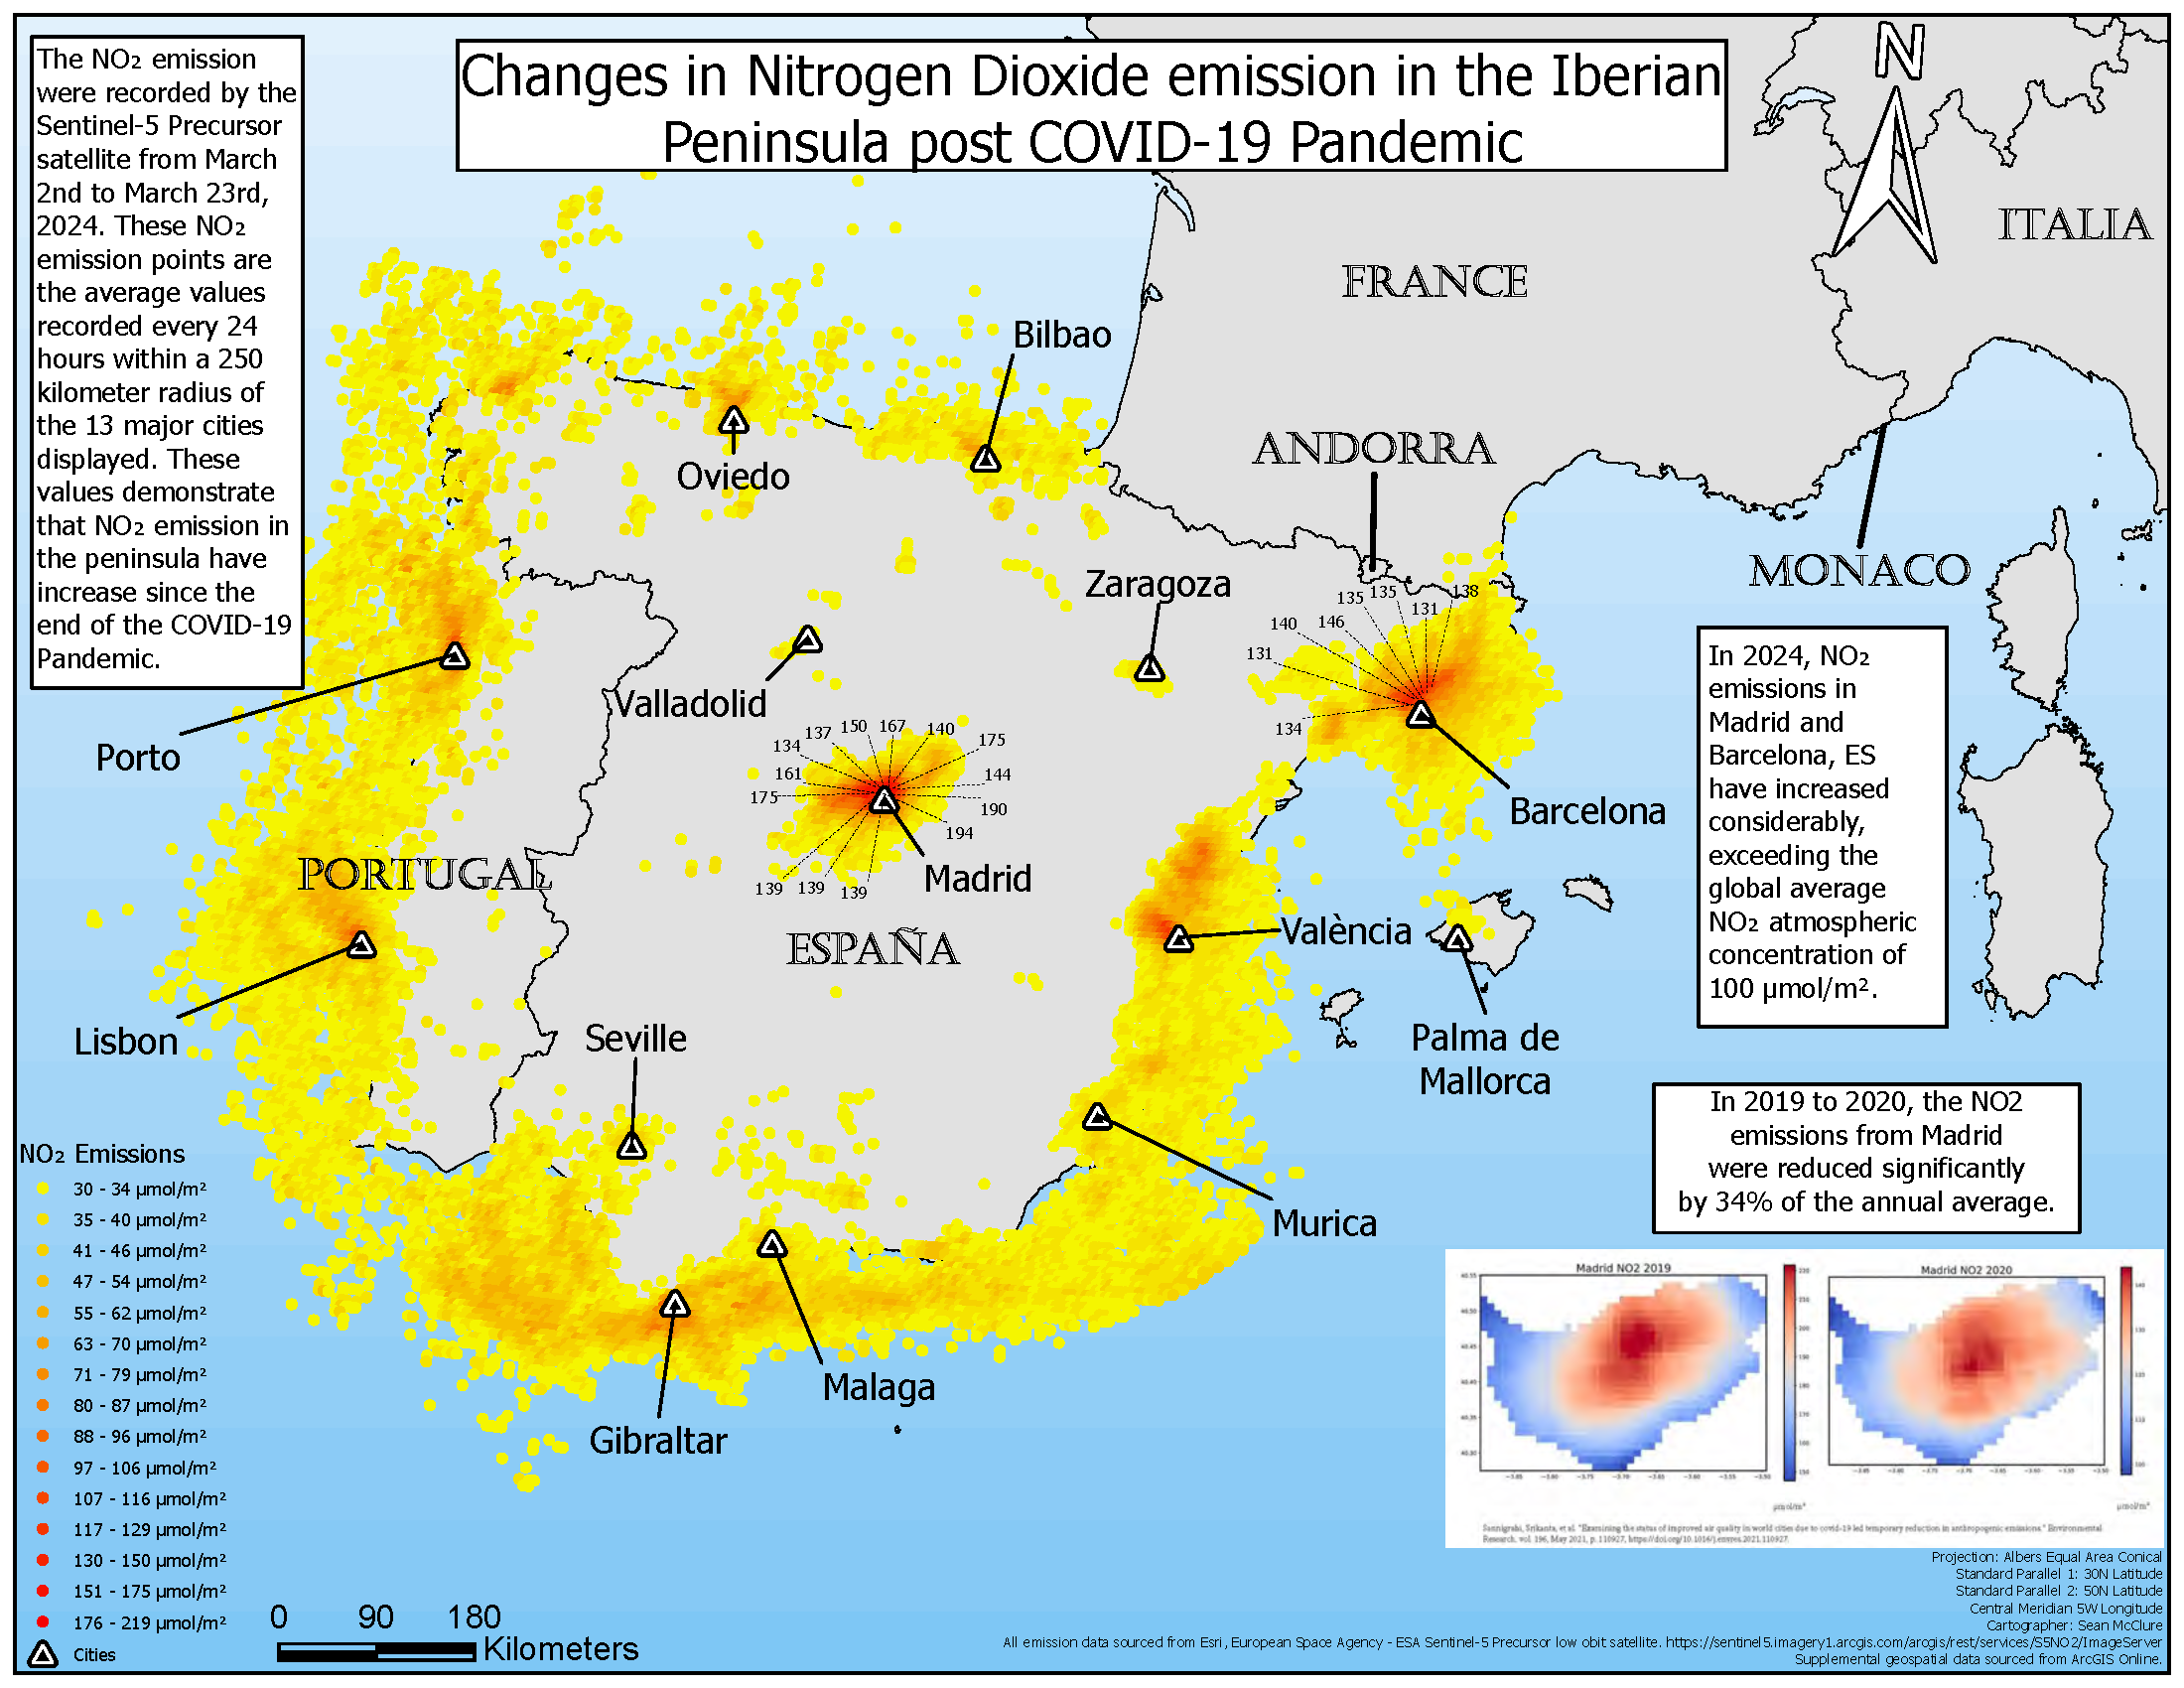
This ArcGIS Online StoryMap analyzes carbon dioxide atmospheric concentrations in the Iberian Peninsula from 2021 to 2023 through multivariate mapping and an organized cartographic workflow. It discusses the relationship between CO2 emissions and average annual temperatures, alongside influencing factors such as government spending on climate initiatives and the Covid-19 pandemic. This project was completed as part of the curriculum for the Advanced GIS Certification graduate-level program offered by the University of Wisconsin-Madison.
View StoryMap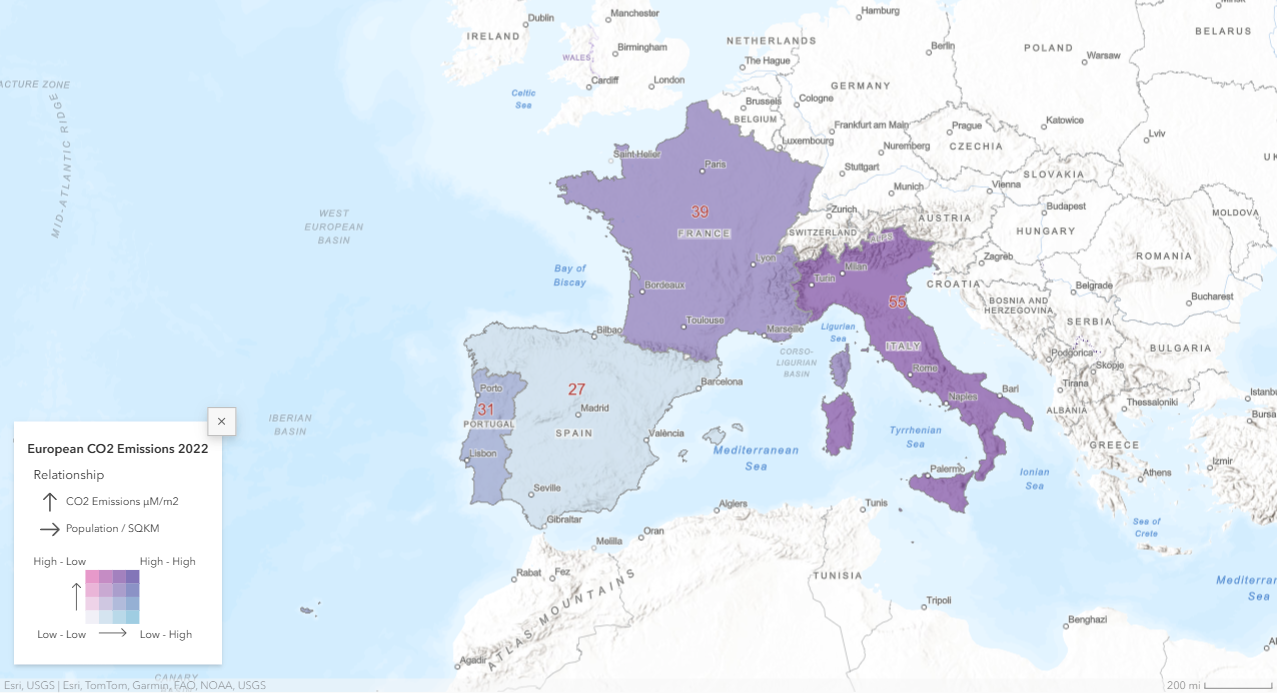
Coffee Tour of Eau Claire, WI StoryMap
This ArcGIS Online StoryMap offers a guided tour of notable coffee shops and cafés in Eau Claire, Wisconsin. The project demonstrates the principles of visual cognition and spatiotemporal representation. The StoryMap introduces a variety of local coffeehouses and other cultural hubs of this Wisconsin community. The tour highlights the city's unique charm while providing optimal walking and biking routes between stops. This project was completed as part of the curriculum for the Advanced GIS Certification graduate-level program offered by the University of Wisconsin-Madison.
View StoryMap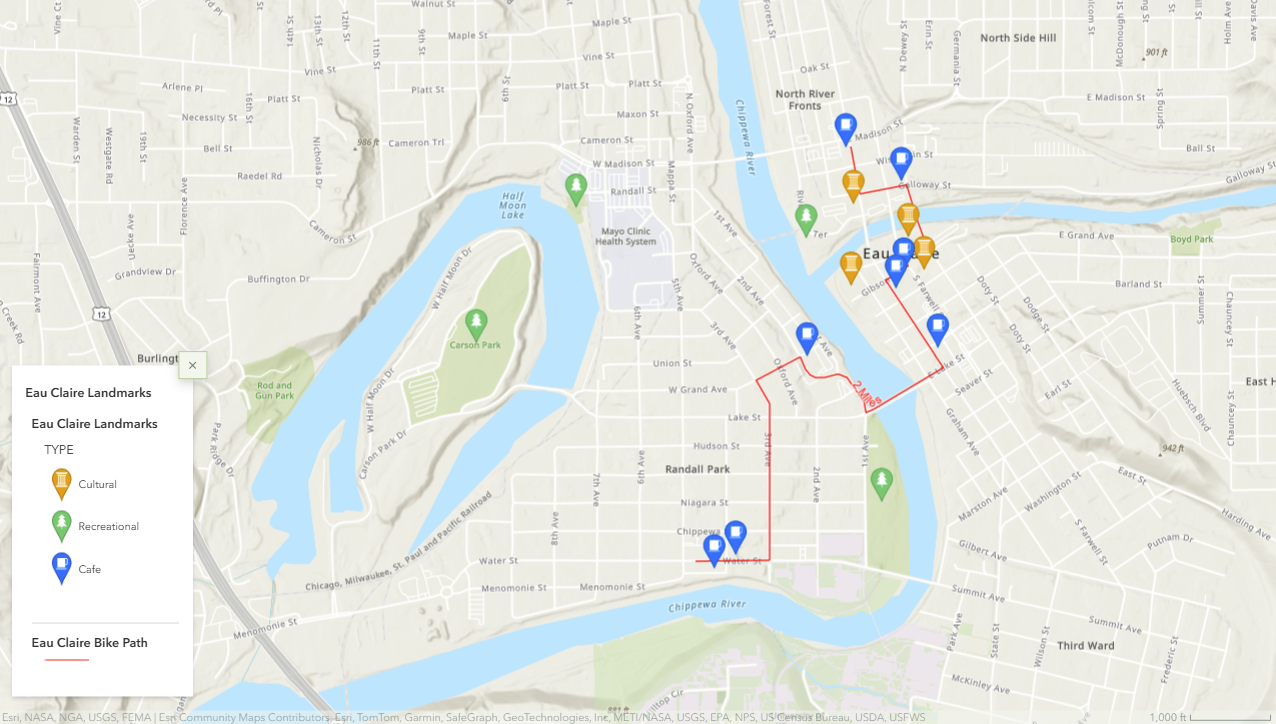
Politcal and Geographic Topography of Africa
This map layout displays the political and geographic topography of the African continent in 2023. The political boundaries of this map range from the country level down to the town level. Geographic features such as mountain ranges, deserts, and rivers are also labeled, providing a comprehensive depiction of the continent at a macro scale. The primary focus of this project was managing complex and dense label placements while adhering to cartographic generalization principles to ensure clarity and readability of the map. This project was completed as part of the curriculum for the Advanced GIS Certification graduate-level program offered by the University of Wisconsin-Madison.
African Political Map PDF
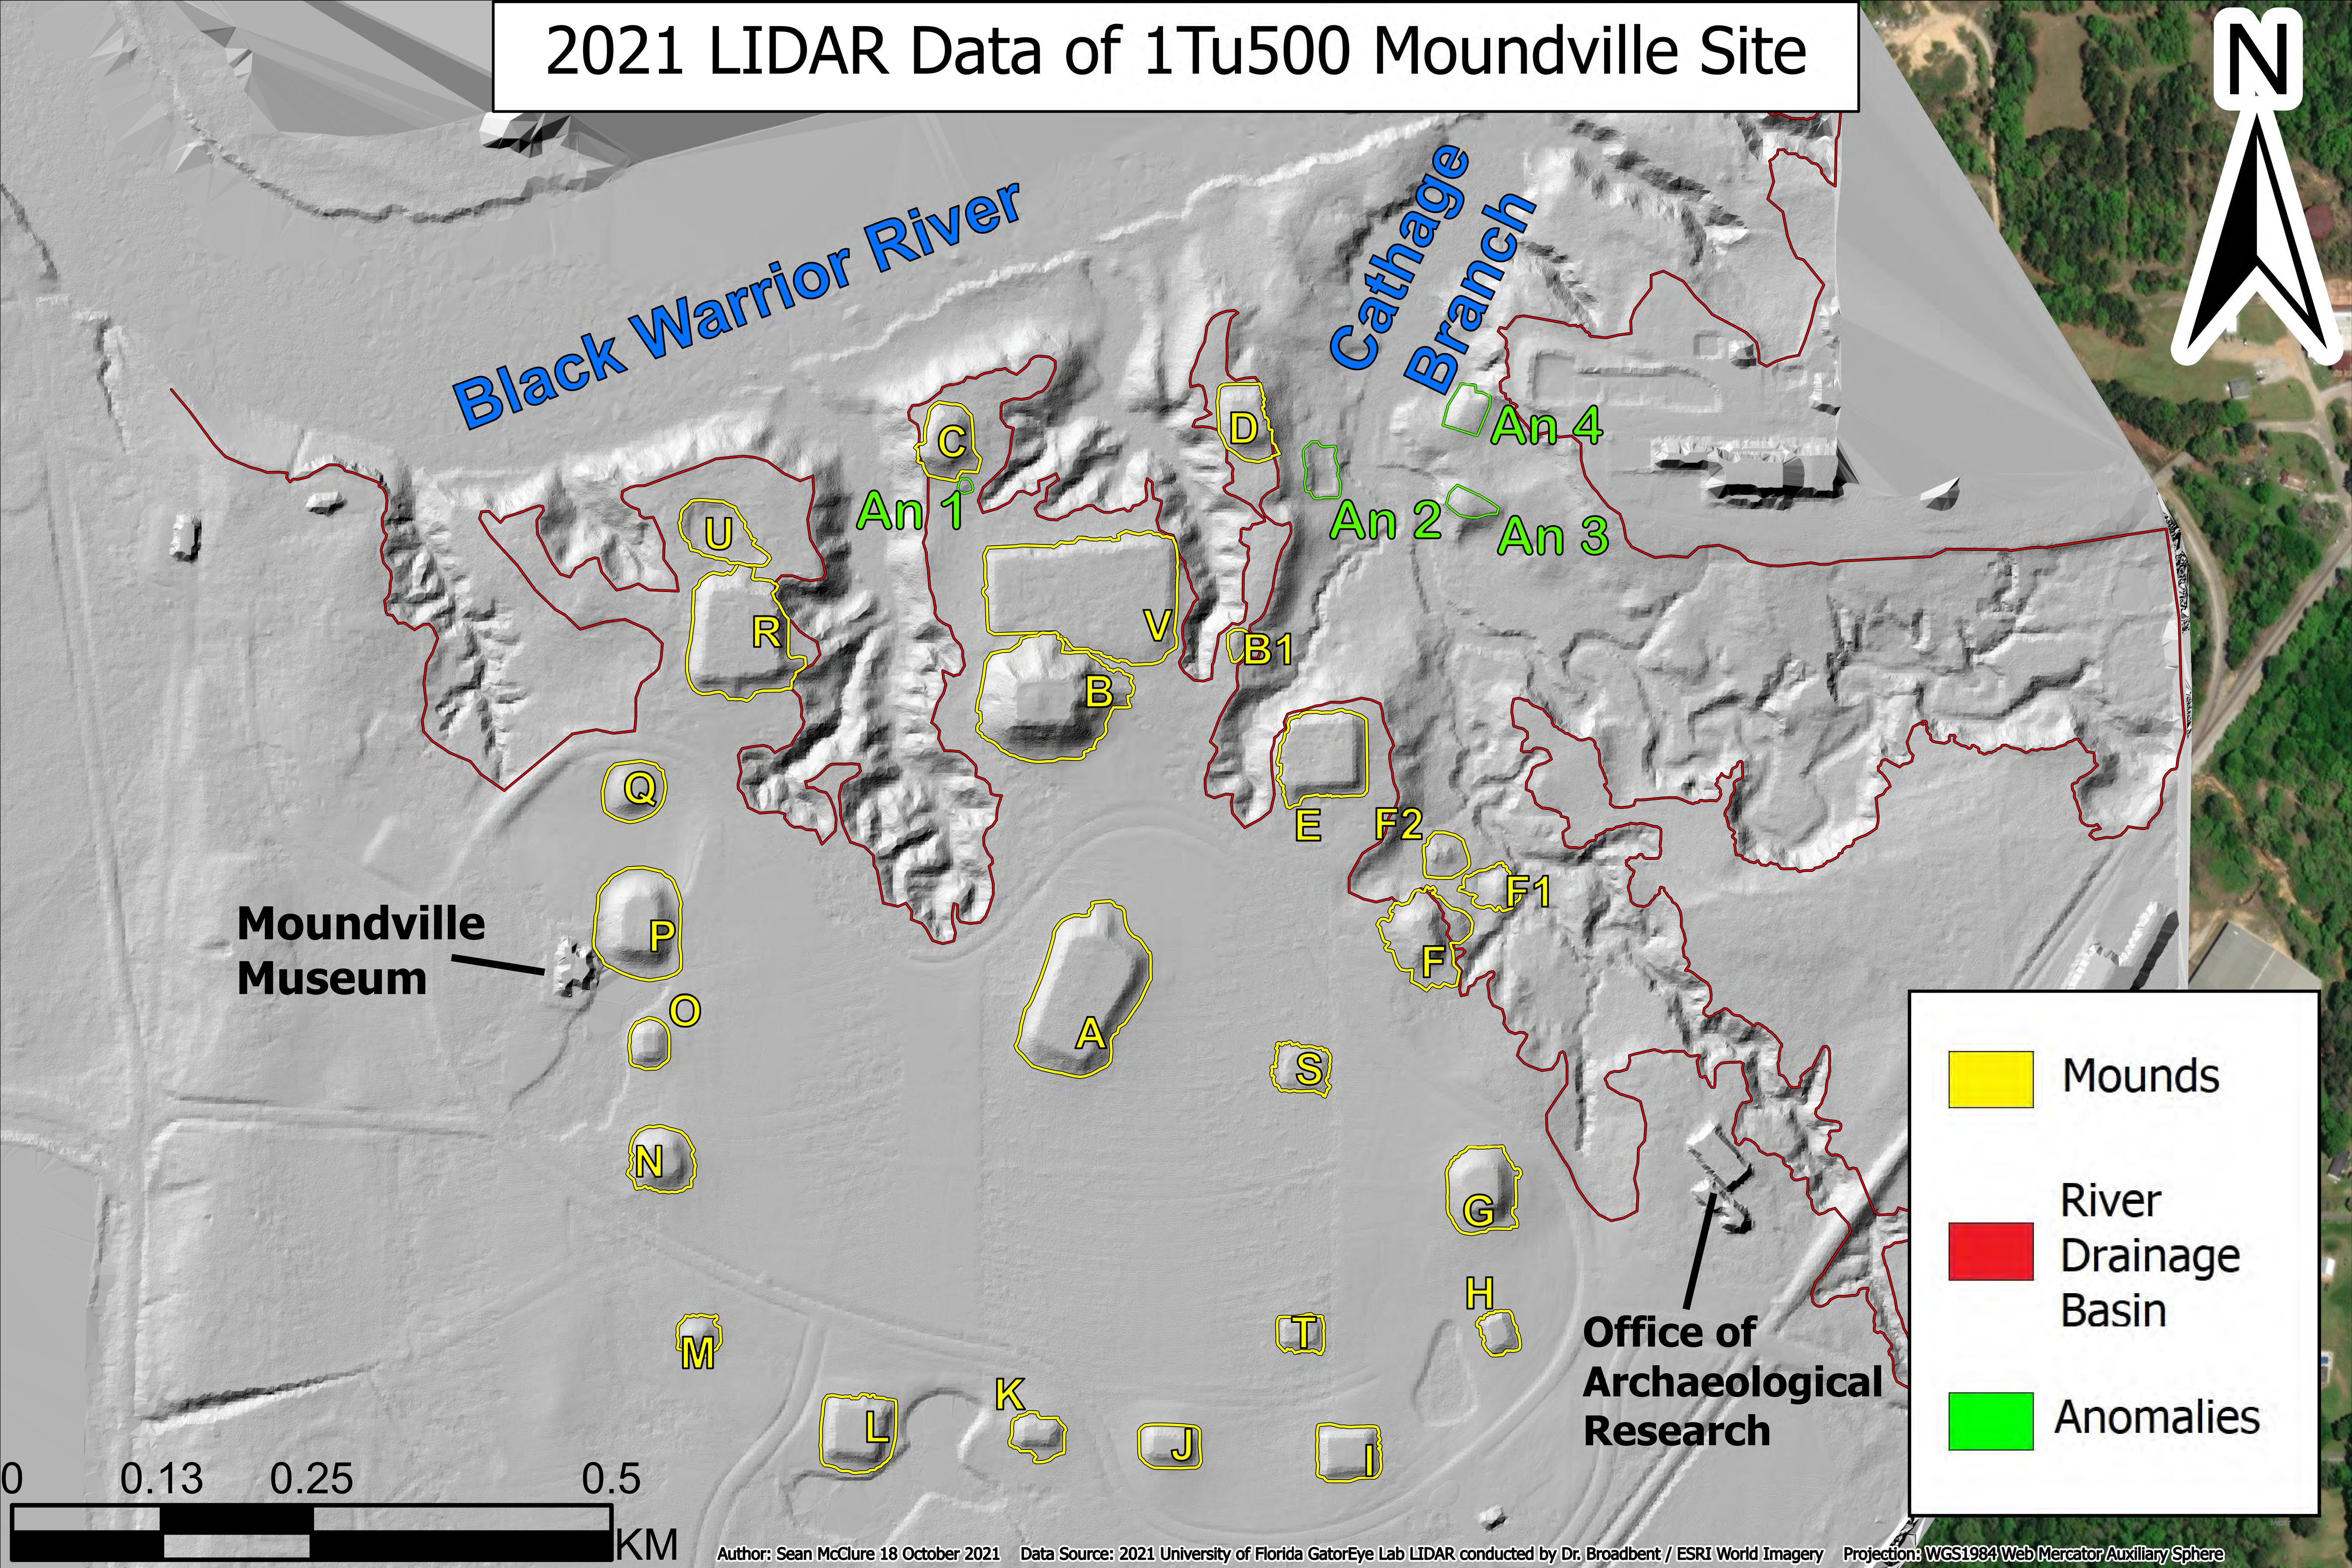
Environmental and Archaeological Analysis Moundville, AL
This project focuses on the analysis of LIDAR data collected in 2021 from the Moundville, AL National Historical Landmark. A digital elevation model (DEM) and hillshade raster files were created from the LIDAR data to examine topographic changes, including erosional damage to mound structures and potential undiscovered anthropogenic deposits. The analysis of the environmental spatial data revealed that the expanding southern boundary of the Hemphill River Bend drainage basin is causing significant erosional decay, affecting several mound structures. The delineated areas of erosion were mapped with polyline feature classes to highlight the ongoing erosional damage and deflation of the mounds. These results provided an updated understanding of the site's topography and were used by the University of Alabama to secure grant funding from the US Army Corp of Engineers to begin efforts to mitigate the erosional damage in 2022.
Moundville LIDAR Analysis PDF